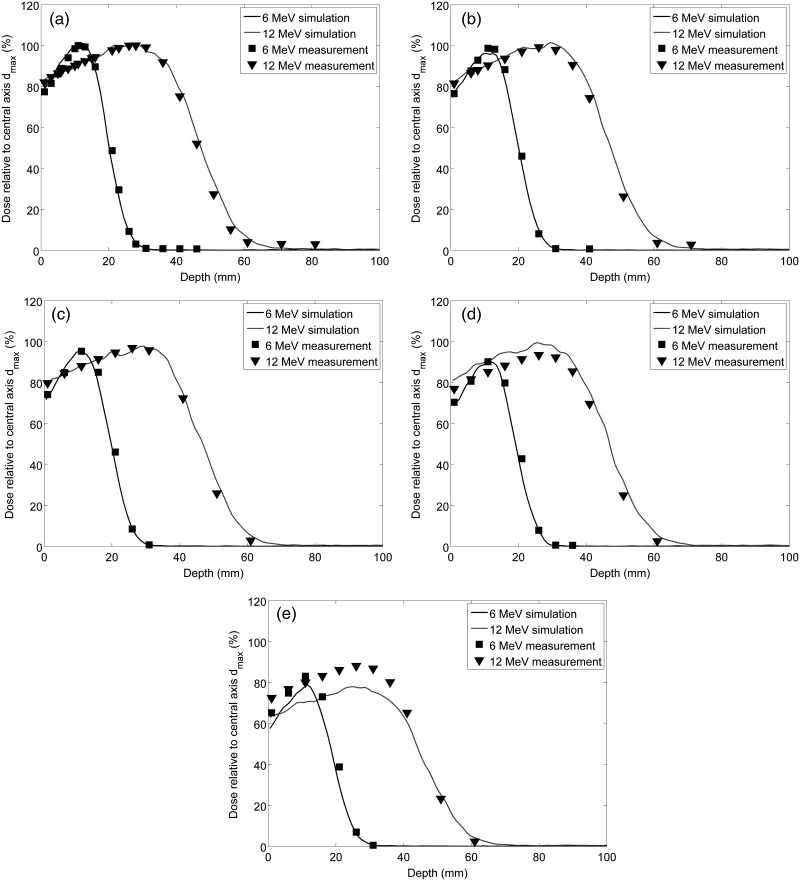
Fig. 2.
Diode measurements in solid water and MC simulated depth dose profiles on the (a) central axis (CAX), and at lateral shifts of (b) 15.2 cm, (c) 30.5 cm, (d) 45.2 cm, and (e) 61.0 cm. The depth dose profiles are shown relative to the maximum dose on CAX for the 6 MeV (squares) and 12 MeV (triangles) electron beams.

