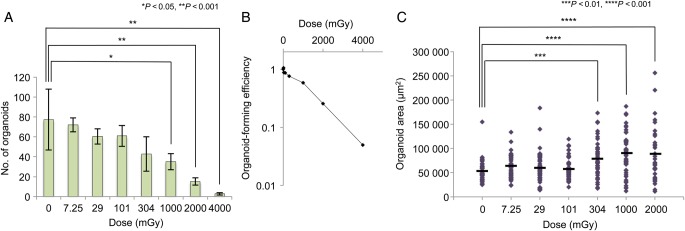
Fig. 3.

Organoid formation and organoid size after IR. (A) The number of organoids formed from 1 × 10⁵ single crypt cells. Data represent the mean ± SEM of two independent experiments. Statistical analysis was performed by Dunnett's multiple comparison test. (B) Organoid-forming efficiency as a function of dose. Organoid-forming efficiency after exposure to the respective doses of IR relative to the unirradiated control is shown. The numbers of organoids shown in Fig. 3A were used to calculate the efficiency. Data represent the mean of two independent experiments. (C) Area of each organoid formed in the experiments shown in Fig. 3A. The organoid area was measured using Image J. A total of 50 organoids in two independent experiments were subjected to the analysis. Black bars represent the mean area of the organoids formed after exposure to the indicated doses of IR. Statistical analysis was performed using Dunnett's multiple comparison test.
