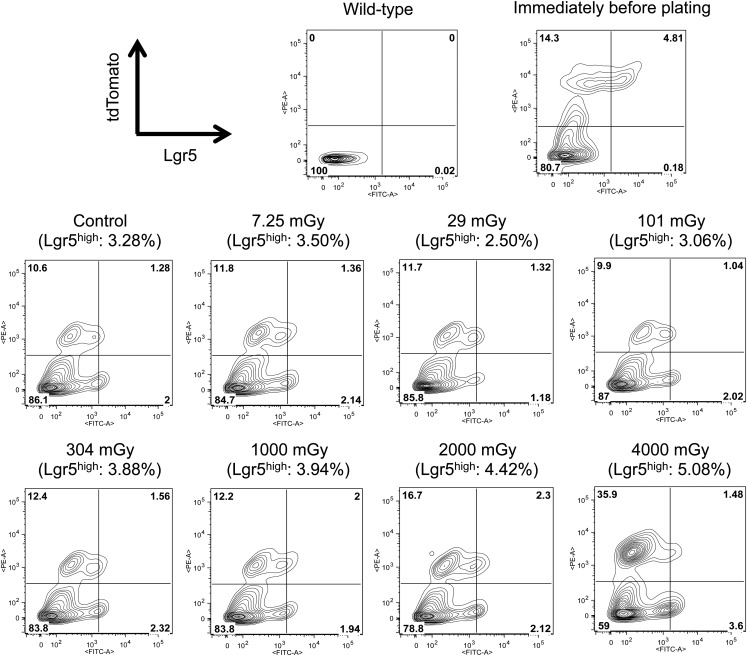
Fig. 4.
FACS analysis of cells in the organoids formed after exposure to various doses of X-rays. The organoids formed in the experiment shown in Fig. 3A were enzymatically dissociated into single cells, and the cells were subjected to FACS analysis. The x- and y-axes indicate the fluorescence intensity of EGFP and tdTomato, respectively. The values in parentheses represent the percentages of cells with high EGFP fluorescence (= Lgr5high stem cells). The whole population is gated in quadrants: the upper left, the upper right, the lower left, and the lower right populations represent Lgr5low/−/tdTomato+, Lgr5high/tdTomato+, Lgr5low/−/tdTomato−, and Lgr5high/tdTomato− cells, respectively. Note that the Lgr5high/tdTomato+ cells are self-renewed Lgr5high stem cells. Data for cells derived from wild-type organoids are also presented to show the validity of gating of the Lgr5high cells. The FACS analysis was performed only once.

