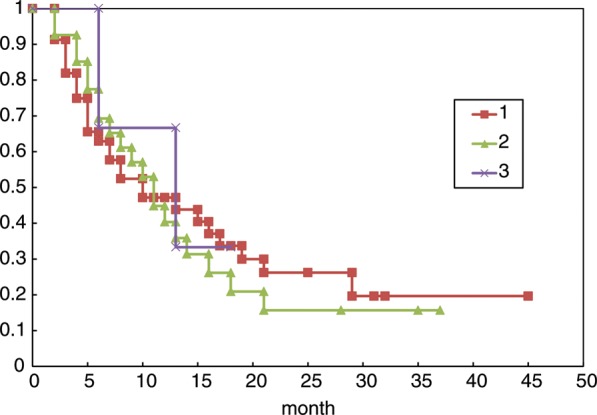
Fig. 3.

Kaplan–Meier survival curves of patients with large brain metastases in three groups: (i) patients with tumors <15 cm3, (ii) patients with tumors 15–30 cm3, (iii) patients with tumors >30 cm3. No statistically significant differences were found among the groups.
