Figure 4.

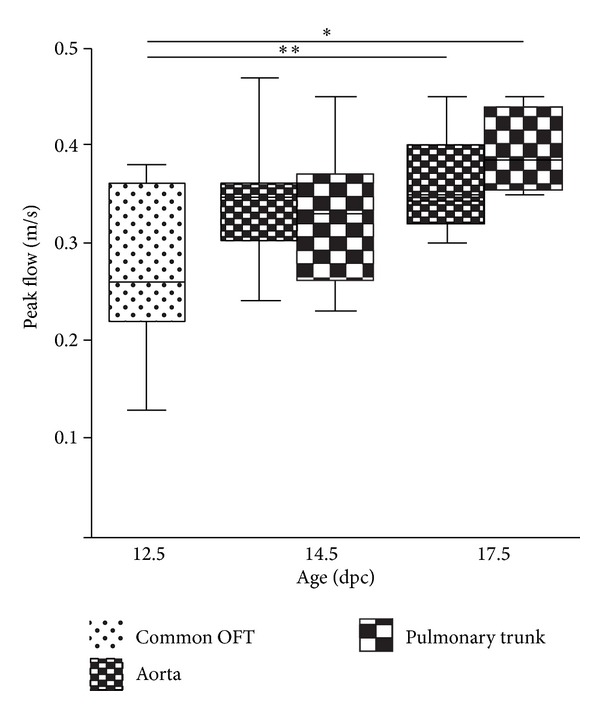
Pulsed-wave Doppler flow measurements in the cOFT, Ao, and PT. The graph demonstrates the significant increase of the peak blood flow measured in the cOFT at 12.5 and Ao and PT at 14.5 and 17.5 dpc.

Pulsed-wave Doppler flow measurements in the cOFT, Ao, and PT. The graph demonstrates the significant increase of the peak blood flow measured in the cOFT at 12.5 and Ao and PT at 14.5 and 17.5 dpc.