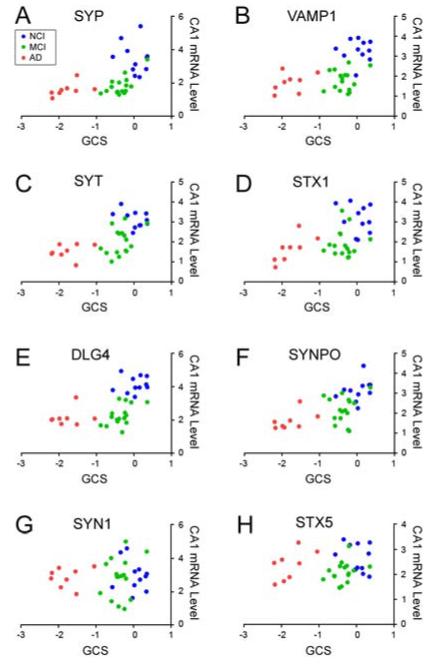
Figure 2.
Scattergrams show that downregulation of select synaptic transcripts in CA1 neurons correlates with poorer global cognitive performance. Relative expression levels for specific CA1 synaptic transcripts were plotted against the global cognitive score (GCS, or z-score of 19 neuropsychological tests, see Methods) for each Religious Orders Study subject under analysis. For each panel, individual cases are color-coded for NCI (blue), MCI (green), or mild/moderate AD (red). Note that for the GCS scale, the more negative the z-score, the poorer the performance on the battery of cognitive tests. Spearman rank correlations for the select transcripts are as follows: A) synaptophysin (SYP), r = 0.66, p < 0.0001; B) synaptobrevin (VAMP1), r = 0.55, p = 0.0006; C) synaptotagmin (SYT), r = 0.64, p < 0.0001; D) syntaxin 1 (STX1), r = 0.49, p = 0.003; E) Discs, Large Homolog 4 (DLG4, or PSD95), r = 0.66, p < 0.0001; F) synaptopodin (SYNPO), r = 0.67, p < 0.0001; synapsin 1 (SYP1), r = 0.04, p = 0.8; syntaxin 5 (STX5), r = 0.18, p = 0.3.

