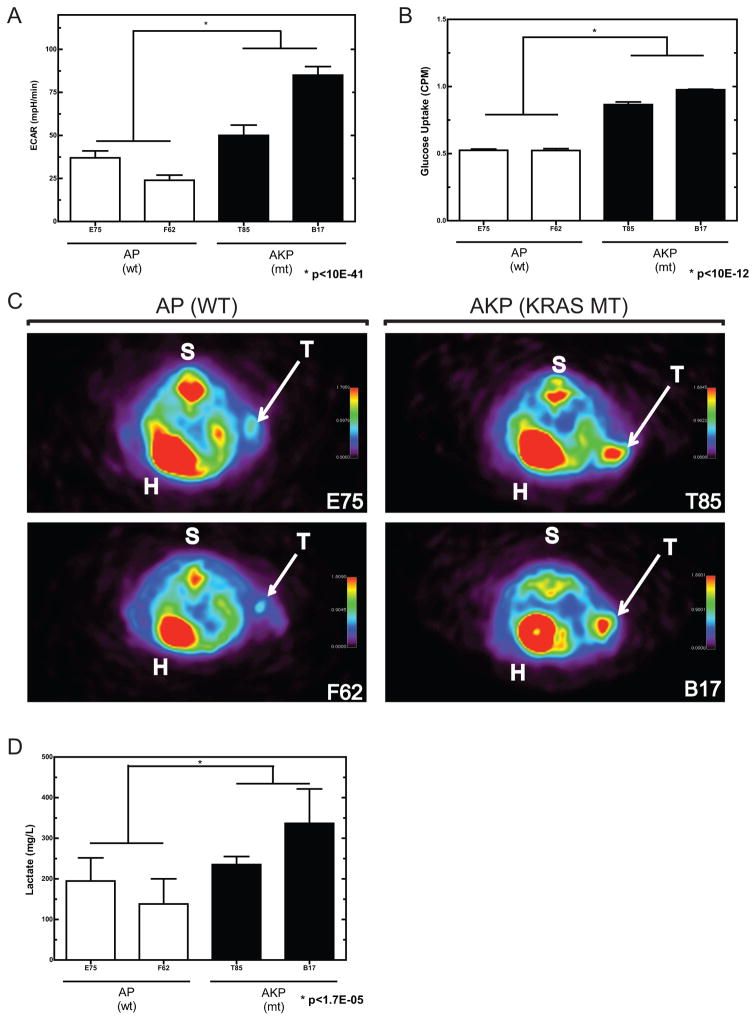
Figure 6. Assessment of in vivo glucose uptake and lactate production in subcutaneous tumors.
A) In vitro measurement of extracellular acidification rate (ECAR) in AP and AKP cell lines. B) In vitro glucose uptake in AP and AKP cell lines. C) Subcutaneous tumors imaged by positron emission tomography (PET) following injection of 18F-FDG. Regions of enhanced signal include heart (H), spine (S), and tumor (T). Tumors from AKP cell lines (Kras mutant) display a greater signal than those from AP cell lines (Kras wildtype). D) AKP tumors display elevated lactate metabolite abundance.

