
Figure 3.
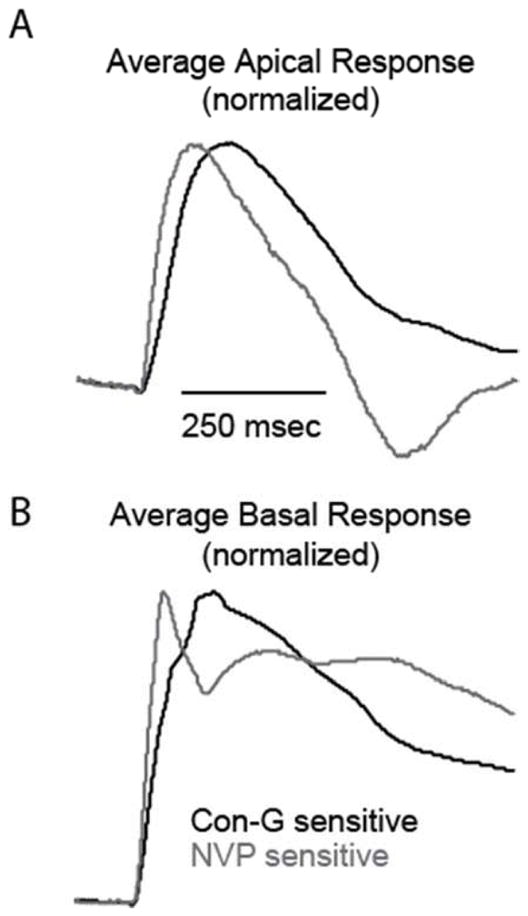
Con-G and NVP sensitive traces show different kinetics in WT mouse neurons. Average component (normalized to max) of the apical (A) and basal (C) dendritic responses sensitive to con-G and NVP. Traces were generated by subtracting treated from non-treated responses at single apical and basal dendritic locations for each neuron then averaged and normalized.