
Figure 4.
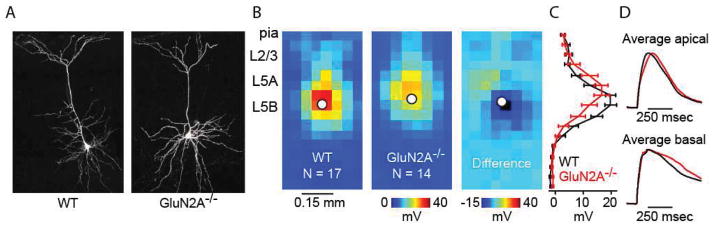
Glutamatergic responses in GluN2A−/− mice have similar magnitude but different waveforms compared to WT mice. (A) Two-photon images of L5 mPFC neurons in WT and GluN2A−/− mice showing similar dendritic morphology. (B) Average dendritic map of L5 mPFC neurons for WT (left) and GluN2A−/− mice (middle). Average difference map (right) shows GluN2A−/− maps subtracted from WT maps. (C) Mean (± s.e.m.) vertical profile, calculated by projecting a map of each neuron to a single vector by averaging along map rows, and then averaging across all neurons. (D) Average apical (top) and basal (bottom) glutamatergic responses (normalized to the maximum) for WT (black traces) and GluN2A−/− (red traces) neurons.