
Figure 5.
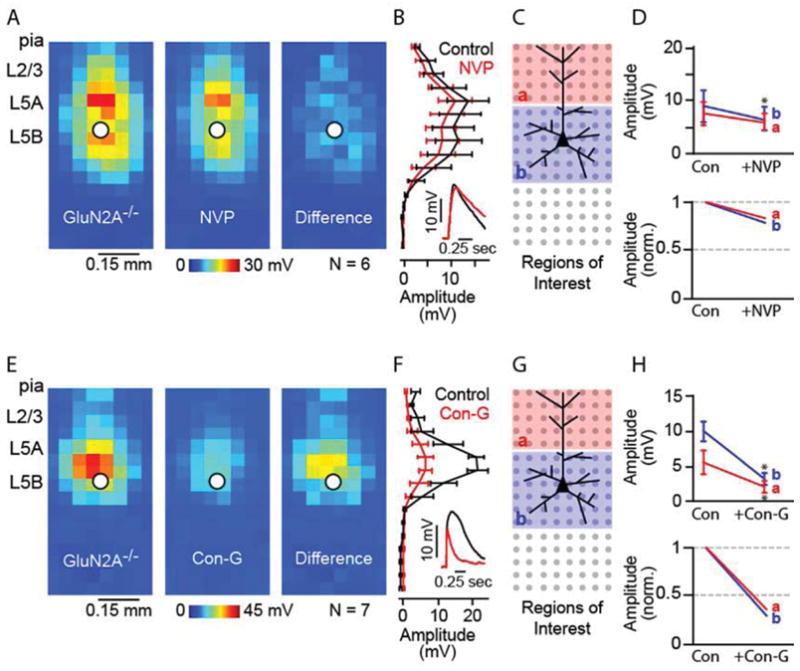
NVP shows reduced effects on excitatory responses evoked across dendritic arbors in L5 pyramidal neurons in the mPFC of GluN2A−/− mice. (A) Average dendritic map of L5 mPFC neurons before (left) and after (middle) application of NVP. Average difference map (right) shows NVP maps subtracted from control maps. (B) Mean (± S.E.M.) vertical profile, calculated by projecting a map of each neuron to a single vector by averaging along map rows, and then averaging across all neurons. (B, inset) Example response traces before (black) and after (red) application of NVP. (C) Schematic of the stimulation grid (8 × 16; 50 μm spacing), radial orientation of the recorded neuron, and the ROI for analysis. (D) Absolute (top) and normalized (bottom) magnitude of NVP sensitivity for apical (A) and basal (b) dendrites (*: p < 0.05, paired t-test); c = control. (E) Average dendritic map of L5 mPFC neurons before (left) and after (middle) application of con-G. Average difference map (right) shows con-G maps subtracted from control maps. (F) Mean vertical profile for con-G effects. (F, inset) Example response traces before (black) and after (red) application of con-G. (G) ROI schematic. (H) ROI analyses, as in d.