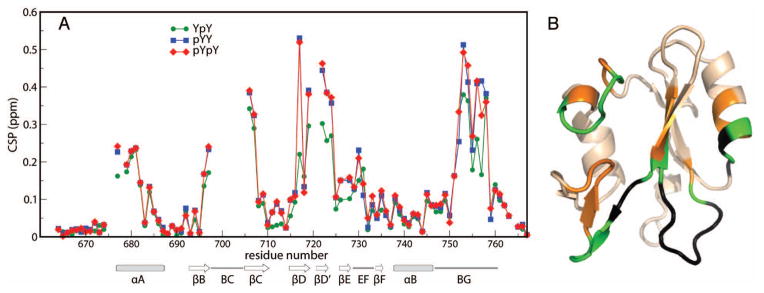
Figure 3.

A: CSP values plotted as a function of Vav1 SH2 residue number for titration with SykLB-YpY (green), SykLB-pYY (blue), or SykLB-pYpY (red) phosphopeptide. B: ribbon drawing of Vav1 SH2 domain (PDB code:2LCT) with large CSP values mapped to the structure: gold are residues with CSP > 0.15 ppm; green are large CSP values for which the SykLB-YpY complex value is smaller than the other two complexes; black are residues for which the resonance is missing in at least one of the three phosphopeptides complexes (residues 676, 678, 698:705, 720:721).
