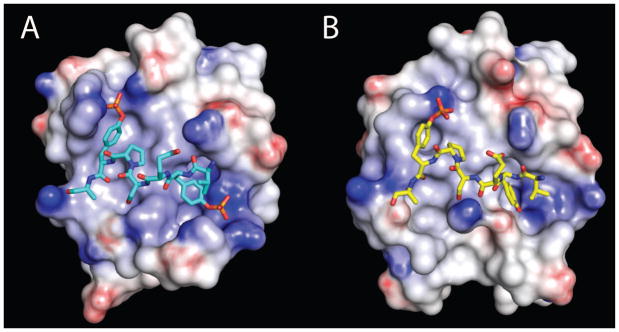
Figure 7.

Electrostatic potential of the Vav1 SH2 domain in the complex with (A) SykLB-pYpY or (B) SykLB-YpY, calculated with the DelPhi program and mapped by color onto the surface of the protein. Darker blue corresponds to increasingly positive charge, and darker red to increasingly negative charge.
