
Fig. 4.
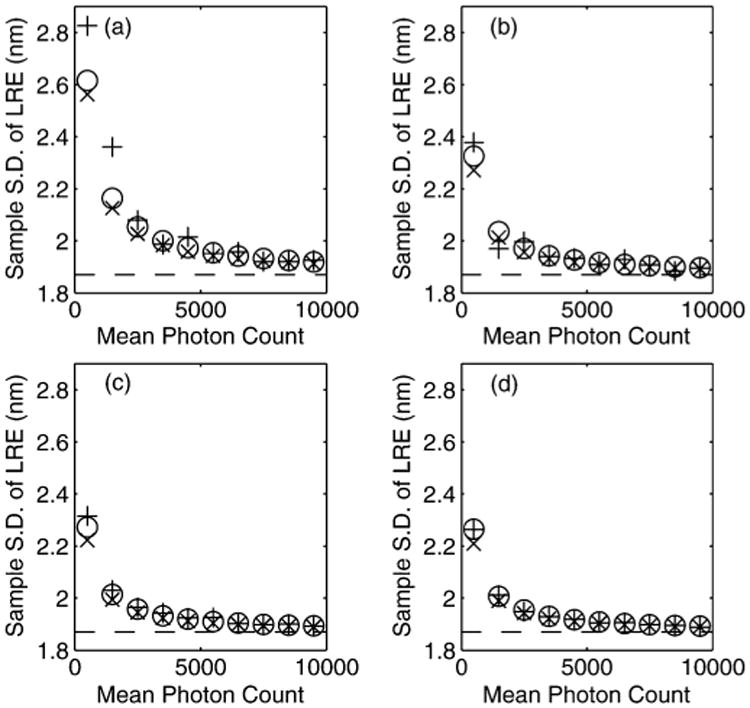
The sample standard deviation of ℓF (from 100000 simulations) in object space dimensions is plotted as a function of N̄1, the mean photon count for the CPs in I1, for a constant K = 16 with (a) normally distributed, (b) uniformly distributed, (c) elliptical and (d) grid CP configurations (see Section VII-B for more details). The ‘+’ represents the sample standard deviation of the LRE (in units nanometers). The circles represent the standard deviation as predicted by Corollary V.2. The ‘×’ shows the standard deviation as predicted with (18). The dashed line marks the theoretical bound σF.