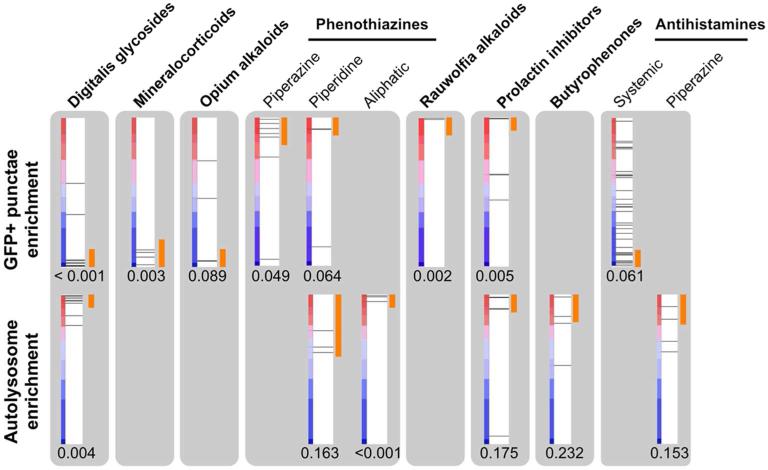
Figure 2.
CSEA-identified compound sets enriched for enhancers of basal autophagy. Each red-blue bar depicts the list of screened compounds, ranked according to their score for GFP+ punctae (top) or mCherry+ GFP- autolysosomes (bottom). Horizontal lines show the position within the ranked list of a member of a compound set. Orange segments denote the set members that contributed to enrichment by the CSEA algorithm. The permutation p-value for enrichment is shown below each bar.

