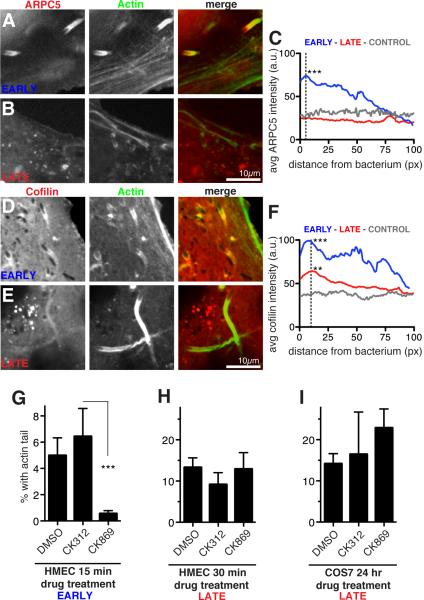
Figure 2. Different host proteins are recruited and required for early and late motility.
(A-D) Confocal micrographs of live HMEC-1 cells stably expressing Lifeact-3xBFP (green) infected with R. parkeri for 30 mpi (early) or 48 hpi (late). Cells also expressed (A, B) mCherry-ARPC5 (red) or (D, E) EGFP-Cofilin (red) [19]. (C, F) Average intensities of line scans along the first 100 pixels (~6.5 μm) of actin tails proximal to bacteria, or control lines in various areas of transfected cells (a.u. = arbitrary units). Intensity measured for 26-36 tails in snapshots of multiple live cells after identical rolling circle background correction using ImageJ. Asterisks indicate significantly different average peak intensities (at 5 pixels for C and 10 pixels for F) compared with controls, with p-values of **p < 0.01 or ***p < 0.001, based on an ANOVA test with Bonferroni’s multiple comparison post test. (G) Percent of all bacteria with an actin tail in HMEC-1 cells infected with R. parkeri for 15 min to allow invasion, then treated with 1% DMSO or 100 μM inactive control (CK312) or Arp2/3 inhibitor (CK869) for 15 mpi, before fixation at 30 mpi. (H) HMEC-1 cells infected with R. parkeri for 48 h, then treated with 1% DMSO or 100 μM CK312 or CK869 for 30 min before fixation. (I) COS7 cells infected with R. parkeri for 24 h, then treated with 1% DMSO or 100 μM CK312 or CK869 for an additional 24 h (with fresh media plus inhibitors exchanged at 32 h, 40 h, and 48 h). For (G-I) cells were stained with Alexa Fluor 488-phalloidin and anti-Rickettsia antibody, and 5-10 random fields of view were imaged. Results represent the mean ± SD of two (G) or three (H, I) independent experiments performed in duplicate, *** p<0.001 indicated means vary significantly by ANOVA with Bonferroni's Multiple Comparison Test. See also Figure S2.

