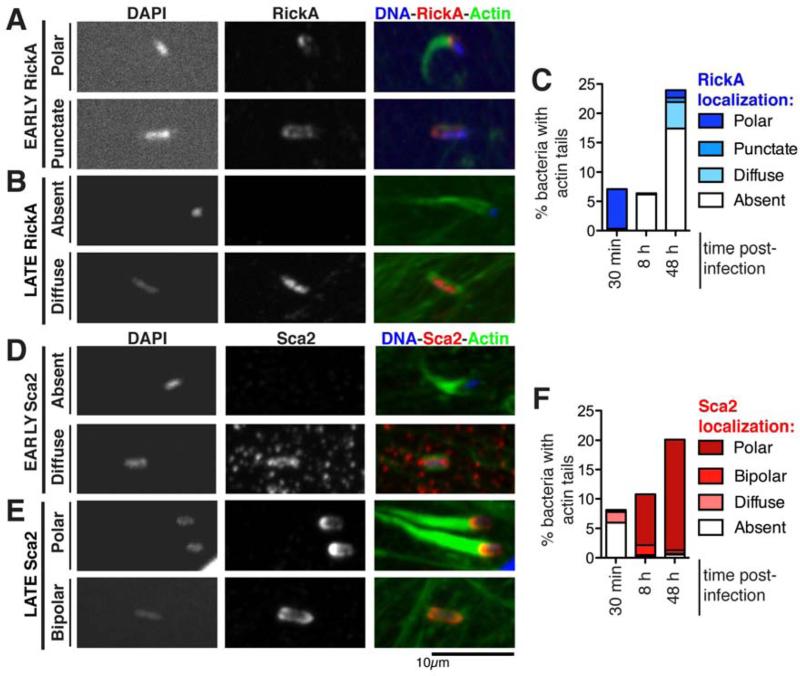
Figure 4. A transition between early and late motility is accompanied by changes in the localization of RickA and Sca2.
(A, B) Localization of RickA using anti-RickA antibody [3] or (D, E) Sca2 using anti-Sca2 antibody [4] in HMEC-1 cells infected with wild type R. parkeri for 30 min (early) or 48 h (late). Cells were fixed and stained for immunofluorescence microscopy with DAPI to visualize DNA and Alexa Fluor 488-phalloidin to visualize actin. Time post infection and localization patterns are noted on the left. (C, F) The percentage of bacteria with the indicated RickA or Sca2 localization patterns was scored for 400-1200 bacteria over two independent experiments. Localization patterns correspond to those shown in (A, B, D, E), and only bacteria also having an actin tail are shown. See also Figure S4 and Table S1.

