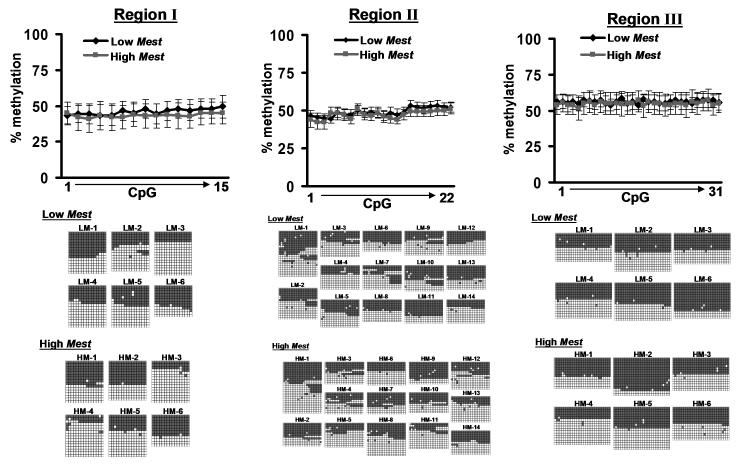
Figure 3.
Bisulfite sequencing analyses of DNA from inguinal fat with low and high Mest expression. DNA from inguinal fat of mice with low (LM) or high (HM) Mest expression corresponding to the data shown in Figure 1 were subjected to bisulfite conversion and sequencing analyses for genomic regions I, II and III (as shown in Figure 2B). DNA was analyzed from at least 6 animals with low and high Mest expression per group with at least 11 clones sequenced per animal. Line graphs show the temporal frequency of methylated CpGs (% methylation) for each genomic sequence. The figures below each line graph indicate the patterns of unmethylated (white squares) and methylated (gray squares) CpGs for each sequenced allele.

