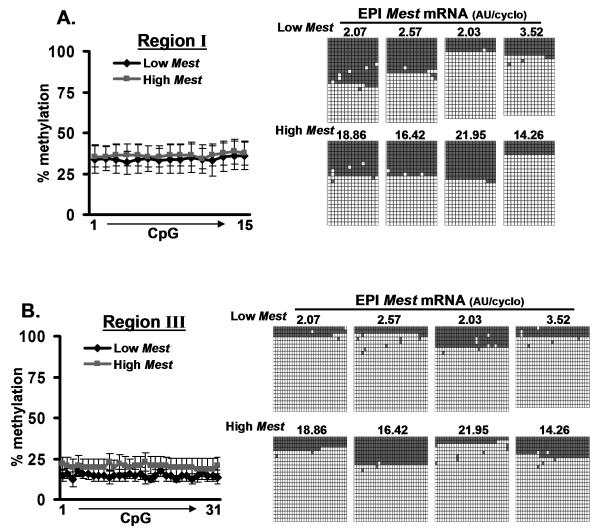
Figure 5.
Enhancement of hypomethylated alleles in adipocytes are not associated with Mest gene expression. Methylation patterns within genomic regions I and III of the Mest promoter were determined in DNA from epididymal (EPI) fat-derived adipocytes from mice with low (n=4) or high (n=4) EPI fat Mest gene expression selected from a cohort of 46 animals fed a high fat diet for 1 week. Line graphs show the temporal patterns of CpG methylation (% methylation) across the genomic regions. Figures on the right-hand side of the of the graphs show the level of Mest mRNA expression of the adipose tissue depot from where adipocytes were derived and the individual alleles sequenced for each DNA with gray squares indicating methylated CpGs and white squares indicating non-methylated CpGs. A minimum of 22 clones were sequenced for each DNA analyzed.

