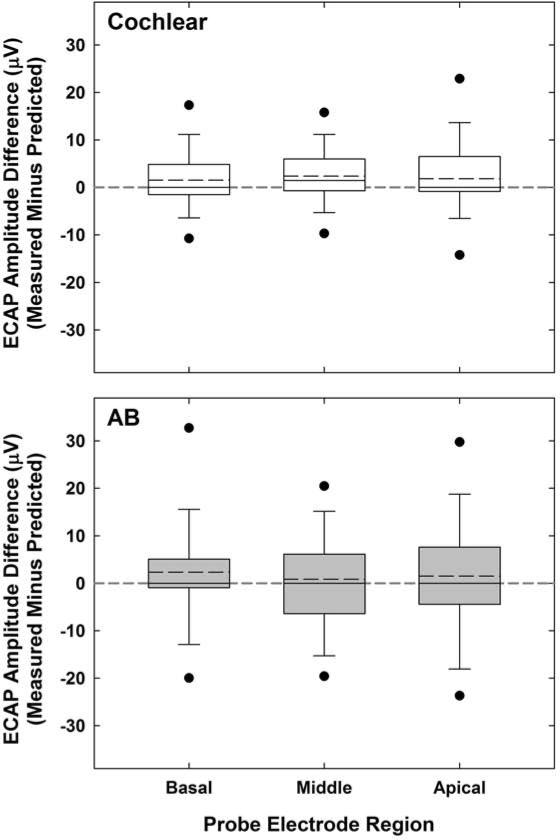
Fig. 3.
Group data showing measured minus predicted ECAP amplitudes for all virtual-channel maskers for Cochlear (top) and AB (bottom) subjects, each separated by probe electrode region. Box boundaries represent 25th and 75th percentiles; whiskers, 10th and 90th percentiles; black circles, 5th and 95th percentiles; horizontal solid lines, medians; and horizontal long dashed lines, means. The gray horizontal short-dashed line extending the length of each graph represents the expected amplitude difference of zero.

