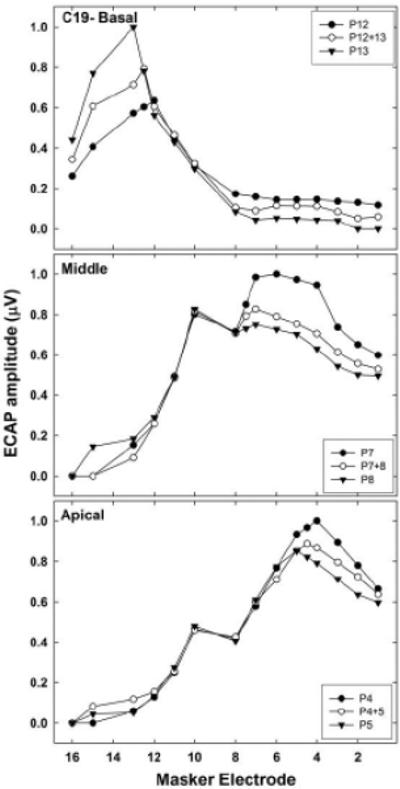
Fig. 6.

Normalized SOE functions for basal (top), middle (middle), and apical (bottom) electrode sets for AB subject C19, illustrating relative differences between functions within each region. Probe electrodes are identified in each figure legend.

Normalized SOE functions for basal (top), middle (middle), and apical (bottom) electrode sets for AB subject C19, illustrating relative differences between functions within each region. Probe electrodes are identified in each figure legend.