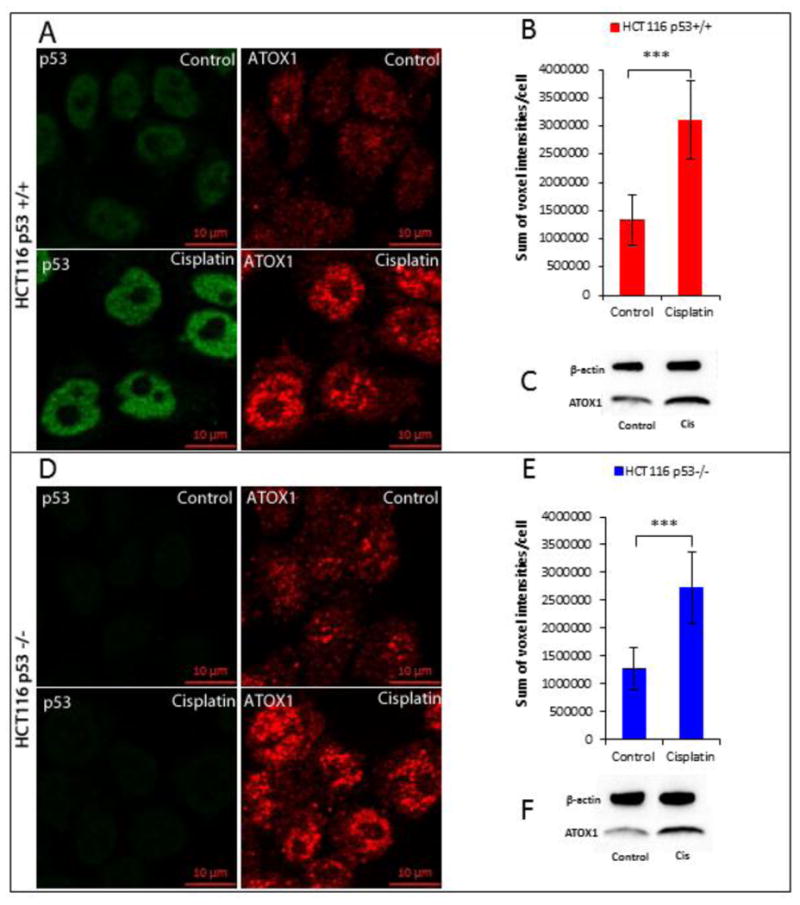
Figure 6.

Effect of cisPt on Atox1 expression in HCT116 p53+/+ and p53-/- cell lines. Confocal images of HCT116 p53+/+ (a) and p53-/- (d) cells treated and non treated with cisPt; cells were seeded on glass coverslips, treated with 40 μM cisPt for 24h h then fixed with 4% PFA; p53 (green) was detected with Mouse Anti-Human p53 antibody and Atox1 (red) was detected with Mouse Anti-Human Atox1 antibody. Quantification of the fluorescence of Atox1 in HCT116 p53+/+ (b) and p53-/- (e) cells treated and non treated with cisPt. Western blot of Atox1 in HCT116 p53+/+ (c) and p53-/- (f) cells treated and non treated with cisPt. (*) p<0.05, (***) p<0.001.
