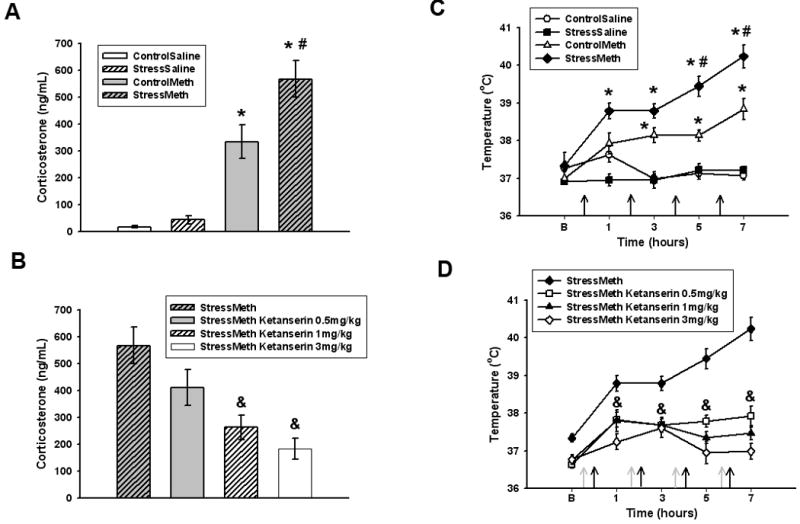
Figure 1.

A. Effects of stress on methamphetamine-induced increases in CORT. *p<0.05 versus control/saline. #p<0.05 versus control/methamphetamine. B. Effects of ketanserin on stress/methamphetamine increases in CORT. &p<0.05 versus stress/methamphetamine. Data are expressed as mean ± SEM. Stress/methamphetamine is re-presented in panel B. n = 6 to 10 rats per group. C. Effects of stress on methamphetamine-induced increases in body temperature. Black arrows represent methamphetamine injections. *p<0.05 versus control/saline. #p<0.05 versus control/methamphetamine. D. Effects of ketanserin on stress/methamphetamine increases in body temperature. Grey arrows represent ketanserin injections. &p<0.05 versus stress/methamphetamine. Data are presented as mean ± SEM. Stress/methamphetamine is re-presented in panel D. B = baseline temperature. n = 6 to 8 rats per group. ControlSaline = control/saline, StressSaline = stress/saline, ControlMeth = control/methamphetamine, StressMeth = stress/methamphetamine
