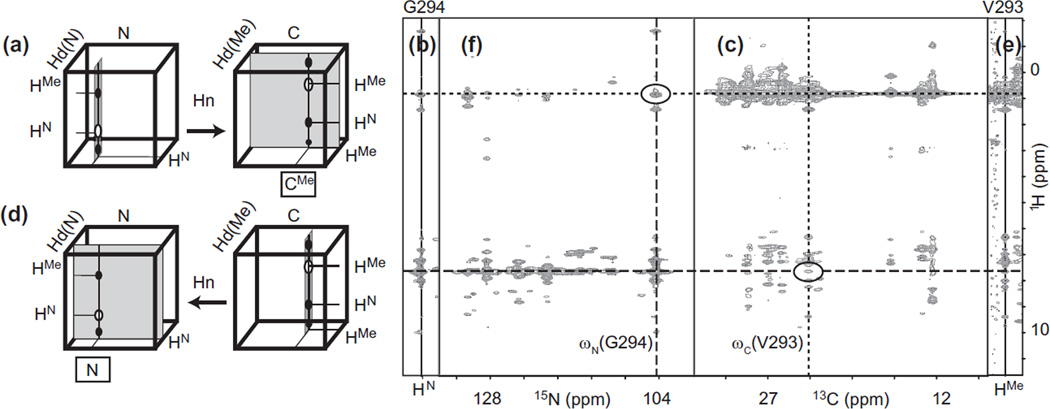
Fig. 13.
HN → HC nOe assignment by matching correlations in orthogonal planes of 3D-NOESY-HN-trosy-HSQC and 3D-NOESY-HC-HSQC. (a) Cartoon representation of the procedure used to assign nOe cross peaks to methyls in a 3D NOESY-HN-trosy-HSQC. (b) HN/H strip of G294 in 3D NOESY-HN-trosy-HSQC recorded on a 53 kDa protein. The horizontal dotted line denotes the proton frequency of the methyl that needs to be assigned and the horizontal dashed line denotes the frequency of HN G294. (c) C/H plane of 3D NOESY-HC-HSQC at the frequency ωHMe = ωHMe(V293) identified in (b). The vertical dotted line denotes the carbon frequency of V293, the only residue with a cross-peak at ωHN(G294). Note that other residues with apparent cross-peaks to G294 can be discarded after viewing expansions (not shown here) around the cross-peaks, which reveals subtle but unambiguous differences in proton frequencies. (d) Cartoon representation of the procedure used to assign nOe cross peaks to amides in a 3D NOESY-HC-HSQC. (e) HMe/H strip of V293 in 3D NOESY-HC-HSQC. The horizontal dashed line now denotes the amide proton that needs to be assigned. (f) N/H plane of 3D NOESY-HN-trosy-HSQC at the frequency ωHN = ωHN(G294) identified in e. See text for details of interpretation.

