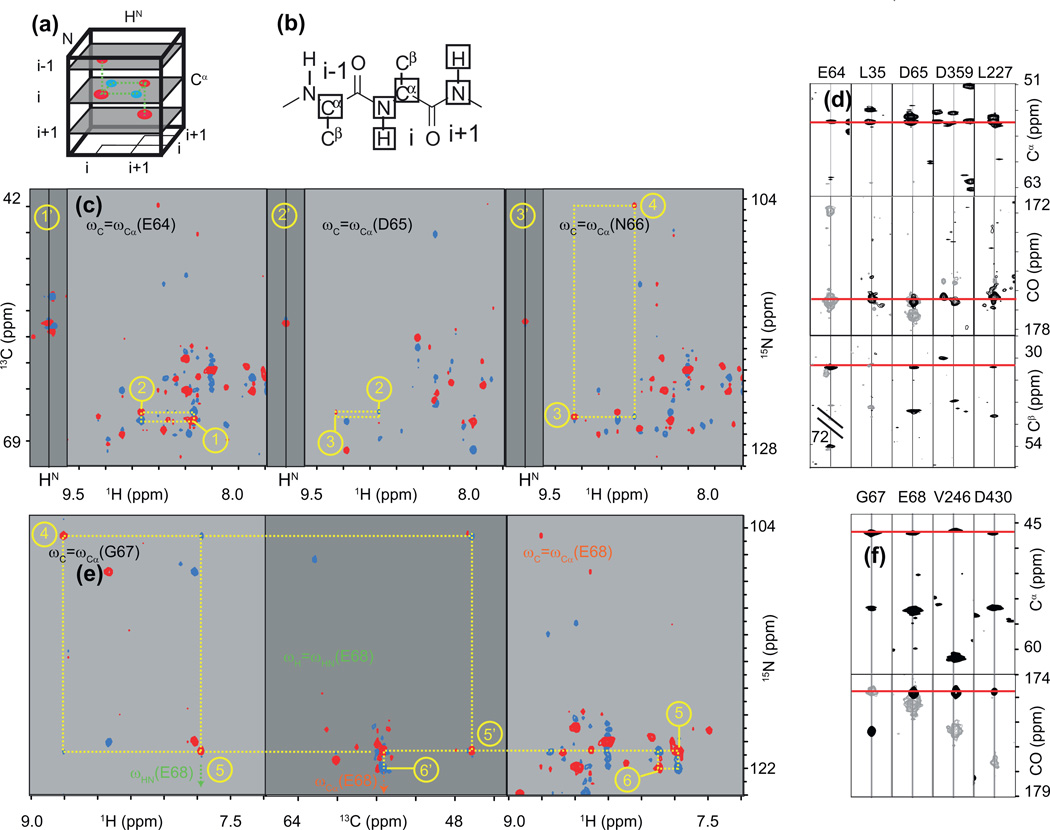
Fig. 9.
trosy-(H)NCA(N)H and “backbone stairway” assignment. (a) Cartoon representation of the trosy-(H)NCA(N)H spectrum. Intra-residue (H, N) correlations appearing at a given carbon frequency are in red and sequential cross-peaks are in blue. (b) Coherences correlated to the {H, N} system of a residue i are depicted as squares on a peptide fragment. (c) Stairway assignment using H/C strips (dark gray) and H/N planes (light gray). The numbers in yellow denote the order in which the signals of sequential residues are identified, and those with a prime (‘) indicate dimensions orthogonal to those without a prime. See main text for further explanation. (d) Unsuccessful strip matching of E64 with D65, corresponding to points (1) and (2) in (c). Signals of trosy-HN(CA)CO are in gray and those of trosy-HNCO in black. The lines (\\) denote an interruption in the chemical shift scale of E64 in trosy-HN(CA)CB. (e) Stairway assignment using C/N planes (dark gray) and H/N planes (light gray). (f) Unsuccessful strip matching of G67 and E68, corresponding to (5) and (6) in (e). Signals of trosy-HN(CA)CO are in gray and those of trosy-HNCO in black. See text for details of interpretation.

