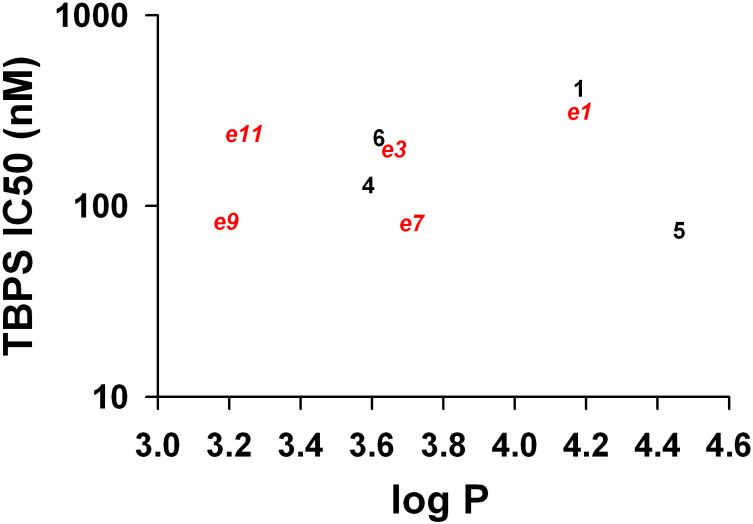
Figure 6.
Correlation between compound logP and log TBPS IC50 values for compounds with reported IC50 values below 500 nM. Red symbols represent enantiomers (“e”). Black symbols represent natural compounds. There was no correlation between logP and log TBPS IC50 (or between logP and TBPS IC50, Supplemental Material Figure S3).

