
Figure 2. A gene regulatory network of HeLa cell genes, reconstructed using different causal inference algorithms.
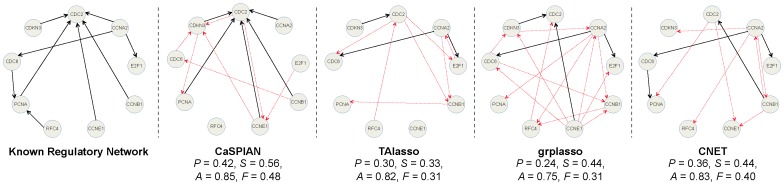
Solid arrows denote true-positives and dashed arrows denote false-positives. True-negatives and false-negatives are not depicted in the figures to avoid cluttering; however, they can be easily obtained by comparing the known regulatory network and the inferred network. Precision is denoted by  , sensitivity by
  , accuracy by
  and the
  -measure by
  .
.