
Figure 3. The SOS network reconstructed using Lasso, TLasso, Algorithm 1 (List-SP) and CaSPIAN.
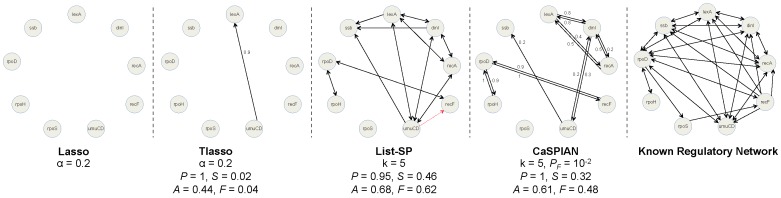
Black solid arrows correspond to true positives and red dashed arrows correspond to false-positives. The numbers above edges describe their multiplicity ratios (MRs); in order to avoid cluttering, we did not plot the MRs for the results of Algorithm 1. Note that only links with MR at least  are shown. Precision is denoted by
  , sensitivity by
  , accuracy by
  and the
  -measure by
  .
.