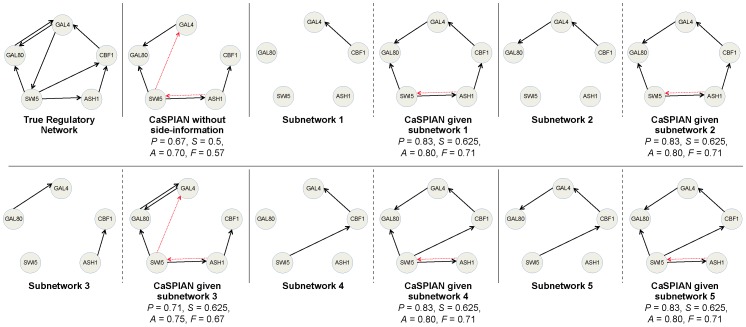
Figure 4. The network corresponding to IRMA obtained by applying Algorithm 3 to various subnetworks.
Parameters of this algorithm were chosen as  and
and  and average gene expressions were used. Solid arrows denote true-positives and dashed arrows denote false-positives. Precision is denoted by
  , sensitivity by
  , accuracy by
  , and the
  -measure by
  .
.

