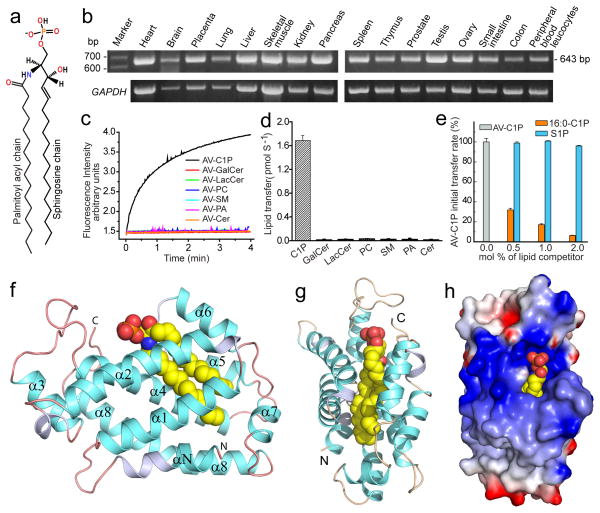
Figure 1. CPTP lipid transfer activity and architecture.
a, 16:0-C1P chemical formula. b, CPTP mRNA transcript levels in various human tissues. c, Lipid transfer in vitro by Förster resonance energy transfer. d, Initial lipid transfer rates for panel c. e, Competition against CPTP-mediated AV-C1P transfer by nonfluorescent lipids. Kinetic traces appear as Supplementary Fig. S1e–g. Data in d and e represent the mean ± s.d. of three independent experiments. f, g, Two views of CPTP structure (ribbon) with bound 16:0-C1P (space-filling). α-helices (cyan), 310-helices (light blue), loops (orange) and bound 16:0-C1P (yellow, red, blue for carbon, oxygen, nitrogen, respectively). α-helices (αN and α1–α8) are numbered from N- to C-termini. h, Surface electrostatics of CPTP with bound 16:0-C1P showing positive- (blue) and negative- (red) charged residues.

