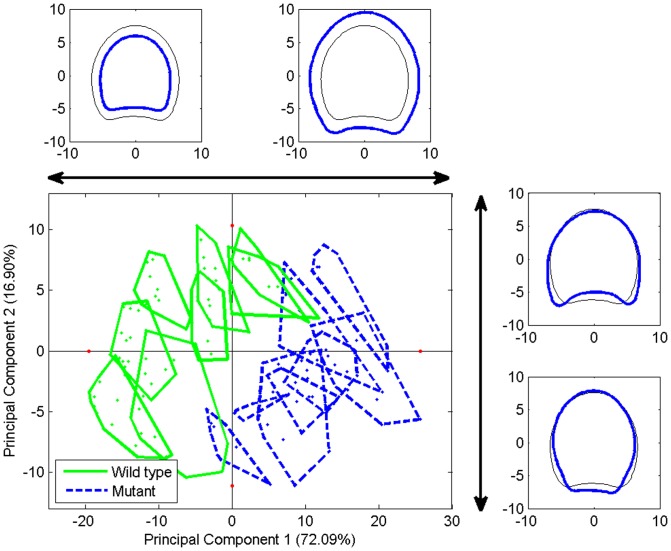
Figure 9. Principal components analysis of stem contours.
Similarity map of components 1 and 2. Individuals corresponding to the same stem are represented within a convex polygon. Synthetic profiles corresponding to extreme scores are represented in thick blue together with the reference contour in thin black for component 1 and on the right for component 2.

