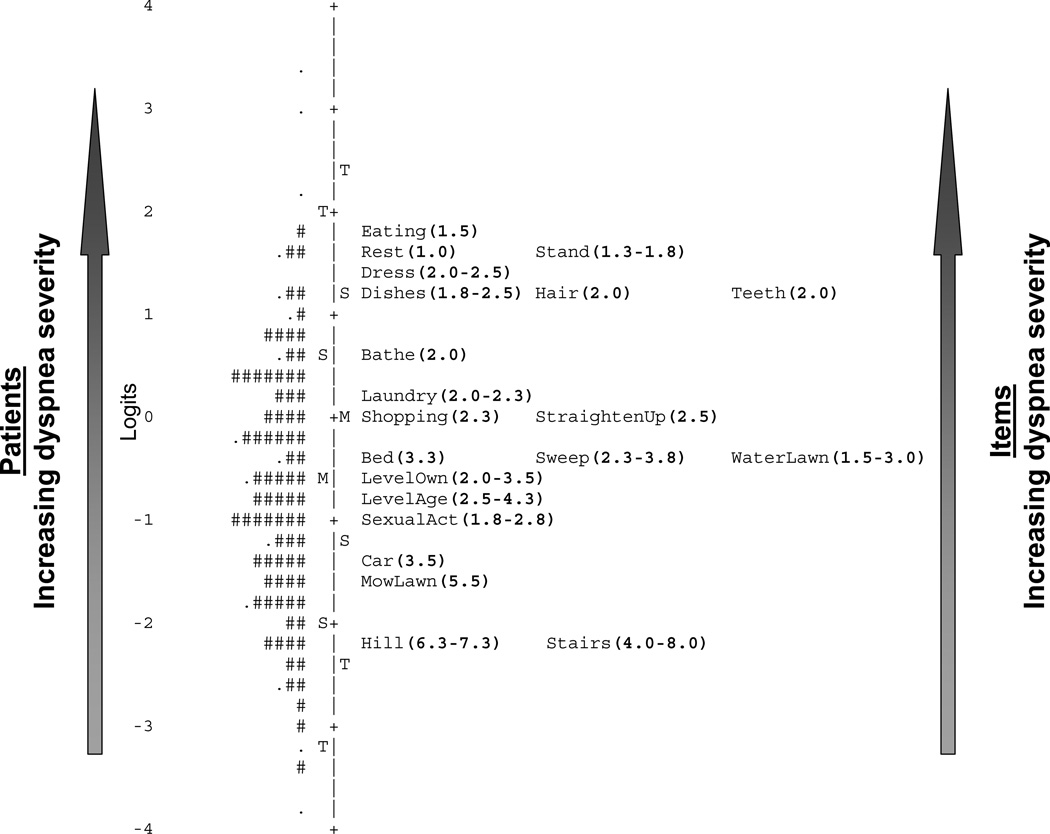
Figure 1.
Item map for the 21 physical activity items from the UCSD.
Footnote for Figure 1. The vertical line separates subjects on the left from items on the right. The units are logits. Each subject is positioned along the vertical line at his dyspnea severity value. “#” = two subjects. “.” = one subject. The “M” on the left of the line = sample’s mean dyspnea level. The “S”s on the left = one standard deviation. The “T”s = two standard deviations from the sample mean. Each item is positioned along the vertical line at its average item difficulty measure. The “M” on the right of the line = mean difficulty of the 21 items. The “S”s on the right = one standard deviation. The “T”s = two standard deviations from the mean. UCSD=University of California San Diego Shortness of Breath Questionnaire

