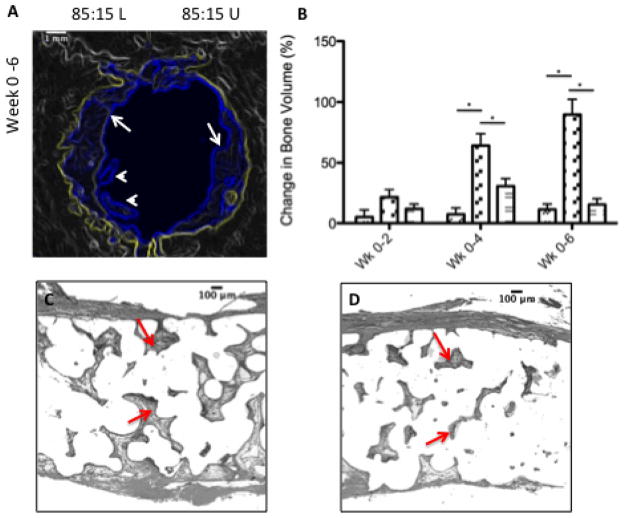
Figure 5.
FTY720 loading increases the amount of new bone formation in the defect region. (A) Microct imaging shows that the amount of bone formed is higher in the half of the defect region that is treated with a FTY720 loaded microsphere scaffold. Yellow outline shows the image of the original defect region at day 0, the blue outline shows the image at week 6 after the new bone formation at the periphery (white arrows) and away from the periphery (while arrowheads). (B) Change in bone volume between weeks 0–2, 0–4, and 0–6 for the empty defect (
 ), the FTY720-loaded side of the 85:15 (L)(
 ) scaffold, and the unloaded side of the 85:15 (U) scaffold (
 ). *Statistical significance, where p<0.05. This result is reflected in the histology. (C) The loaded side of the scaffold (left) shows more bone formation (red arrows) compared to the (D) unloaded side (right). All histological analysis was done 6 weeks after treatment.

