
Figure 2. Critical micelle concentration assessed via fluorescence spectroscopy.
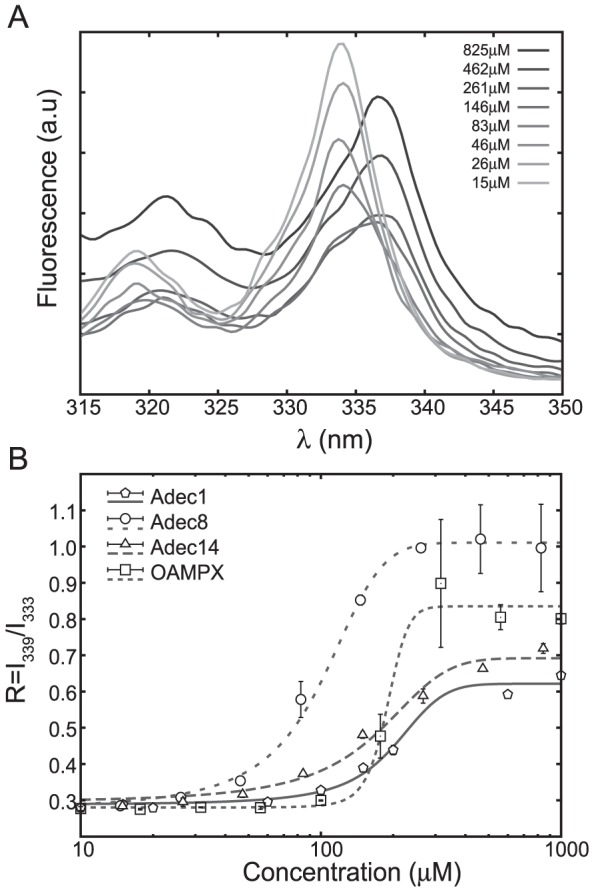
As an example, pyrene fluorescence excitation spectra are shown for a concentration sequence of Adec8 in (A). The formation of micelles is monitored via partitioning of pyrene into the hydrophobic cavity of the forming micelles. This induces the observed peak-shift of pyrene (A), which is quantified via the intensity ratio R = I339/I333 plotted in (B) as a function of peptide concentration. In the current work, the cmc is defined as the point where R deviates from the background signal.