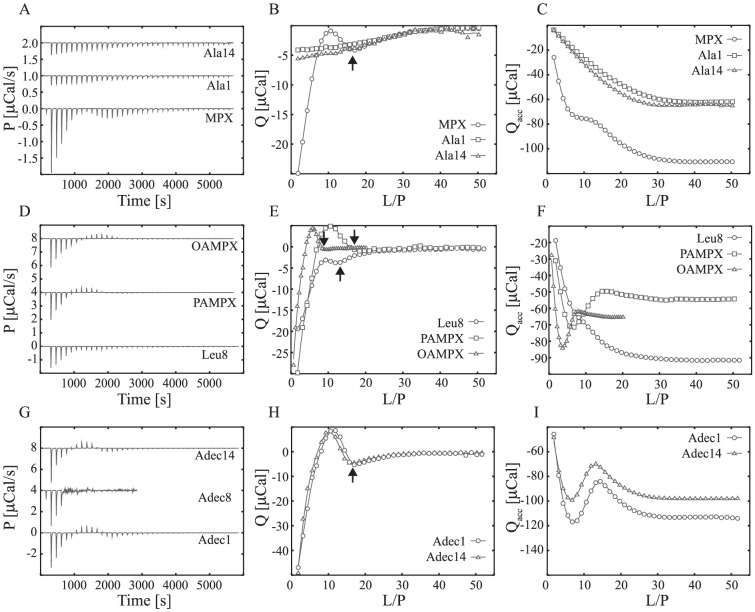
Figure 4. Mode of peptide-membrane interaction evaluated using ITC at 37°C.
Panel A–C shows the heat trace of 20 mM POPC∶POPG (3∶1) LUVs injected into 100 µM peptide (38×1 µL injections), except for OAMPX which was titrated using 8 mM LUVs. The corresponding heat of reaction (Q) and accumulated heat of reaction (Qacc) are shown in panel D–F and G–I respectively. The arrows in panel D–F highlight the endpoint of the secondary process and the solid lines serve to guide the eye.

