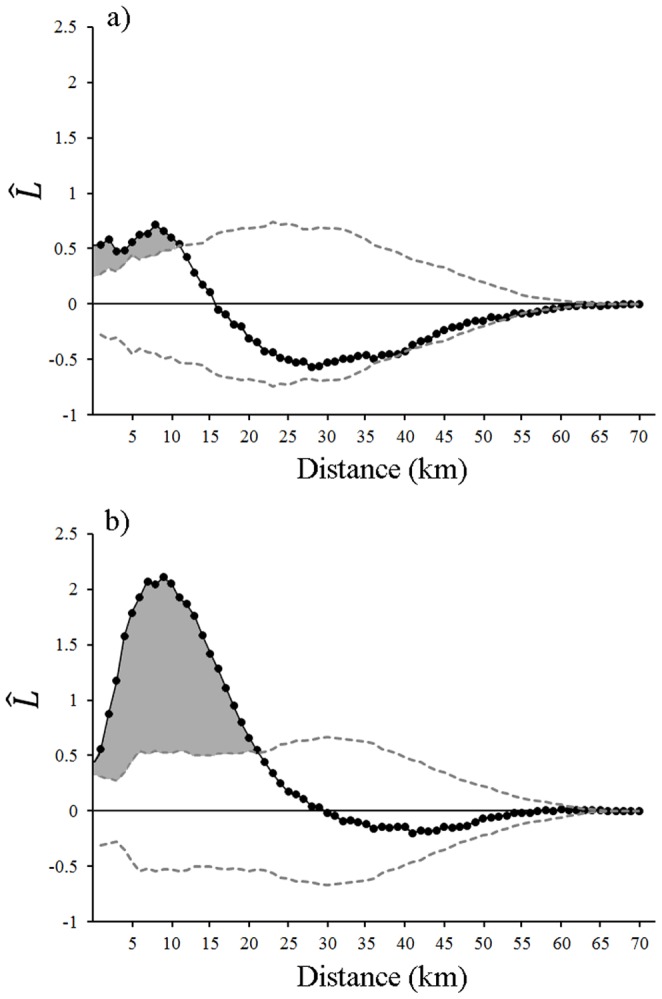
Figure 2. The observed values (plotted with black circles and black line) in relation to distance (km) between locations of a) prime moose and b) senescent moose carcasses in Isle Royale National Park, Lake Superior, USA, 2000–2008.

Expected L(t) values are represented by the horizontal line at 0, 99% confidence intervals are depicted with the hatched lines, and significant spatial clustering of carcass locations at the α = 0.01 level is represented by the grey shading.
