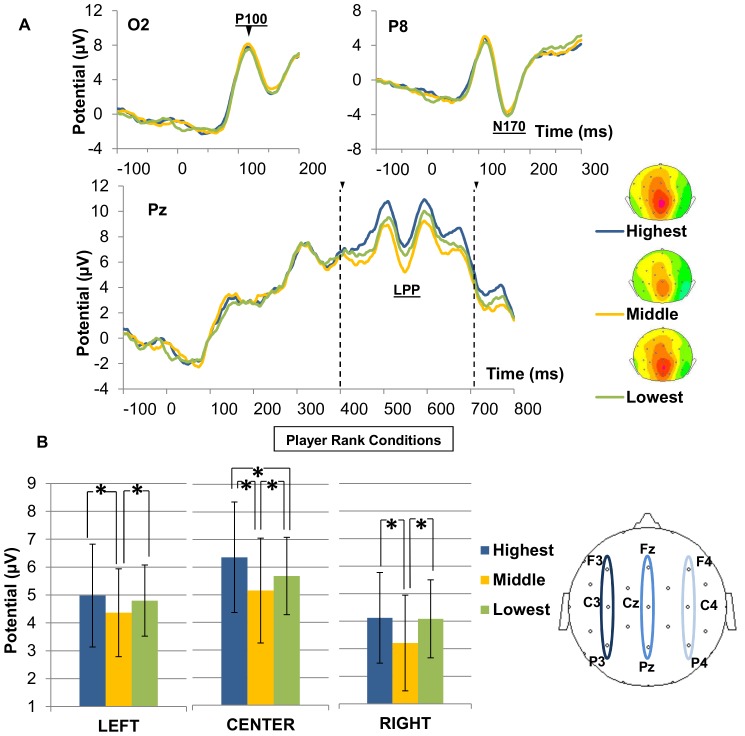
Figure 4. ERP waveforms and averaged signal of P100, N170 and LPP components.
A) ERP waveforms of early (P100 and N170) and late (LPP) responses in the three player rank conditions (highest, middle or lowest rank). Associated back-view topographic maps represent the averaged amplitude of LLPs at 550 ms. B) Averaged LPP amplitude in the 400–700 ms time window computed on the left (F3, C3, P3), central (FZ, CZ, PZ) and right (F4, C4, P4) scalp regions in the 3 player rank conditions. * indicates a significant difference (p<0.05).

