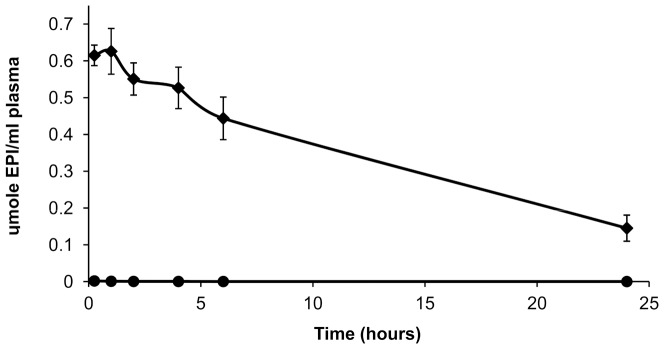
Figure 5. Plasma elimination of liposomal EPI.

The plasma concentrations of EPI after the injection of the HSPC/Chol/DSPE-PEG 2000 (5.5:4:0.5 mol/mol) EDTA/EPI liposomes (⧫) and free EPI (•), into the mice at a dose of 34.5 μmole/kg body weight (20 mg/kg). The bars represent the means +/− SD of five analyses
