
Figure 2. Summary of X-ROS signaling in heart.
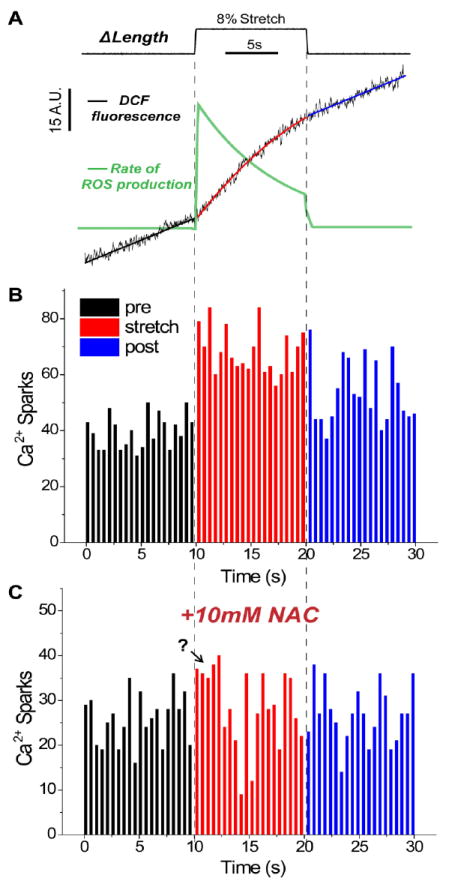
A, Average DCF fluorescence signal (black) from ventricular myocytes stretched 8% of cell length (n = 36 rat cells). The pre and post stretch intervals are well fit by a linear function, while the stretched interval is better fit by a polynomial function. Taking the derivative of these DCF fits gives the rate of ROS production (green). There is a rapid and transient increase in the rate of ROS production upon stretch. B, Histogram of Ca2+ sparks (n = 3,233 sparks) from 52 myocytes stretched as above. There is a rapid increase in the frequency of Ca2+ sparks (500ms bins) upon stretch. C, Histogram of Ca2+ sparks (n = 1,715 sparks) from 29 myocytes pre-treated with 10mM of the general anti-oxidant N-acetylcysteine and stretched as above. NAC blocks any statistically significant change in Ca2+ spark frequency; the question mark denotes a possible initial stretch-dependent increase in spark rate that is not blocked by NAC (Modified from [1]).