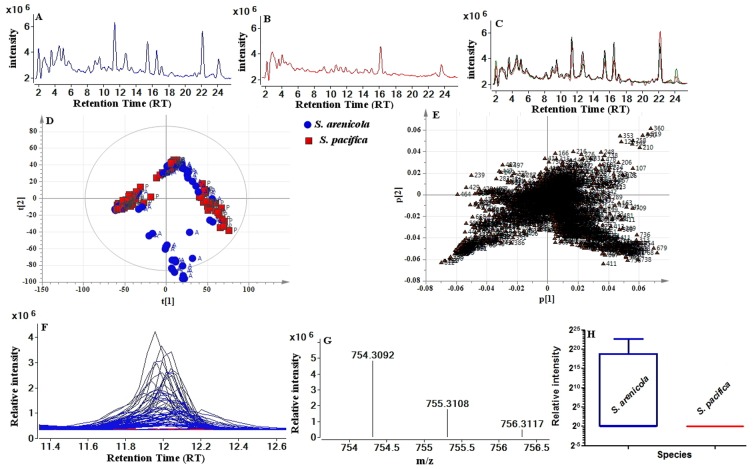
Figure 2. Identification of species-specific compounds in extracts of S. arenicola and S. pacifica by UHPLC-QToF-MS and PCA.
(A) Total ion current (TIC) chromatograms of S. arenicola and (B) S. pacifica (C) TICs from the same (S. arenicola) subset of samples (three replicates) to highlight the reproducibility of acquisition. For ease of interpretation, chromatograms of 2 to 24 minutes are shown to illustrate the period of chromatography during which most compounds elute. Full chromatograms for both species are available in the Supplementary information (Figure S6). (D) Principal component analysis (PCA) scores plot, PC1 (t[1]) versus PC2 (t[2]) showing the variation in the profiles of secondary metabolites from two species: S. arenicola (A, blue) and S. pacifica (P, red). Each symbol represents one bacterial strain described by all detected metabolites. (E) Inspection of the 2-D loadings plot for PC1 vs. PC2 reveals the variables responsible for the spatial arrangement of samples. (F) Extracted ion chromatogram (EIC) of m/z 754.3092 from both species, showing clear species differences in the abundance of this metabolite S. arenicola (blue) and S. pacifica (red). (G) MS spectrum for EIC peak. (H) Box-and-whisker plot of the abundance of the 754 ion in the two species (P<.0001).

