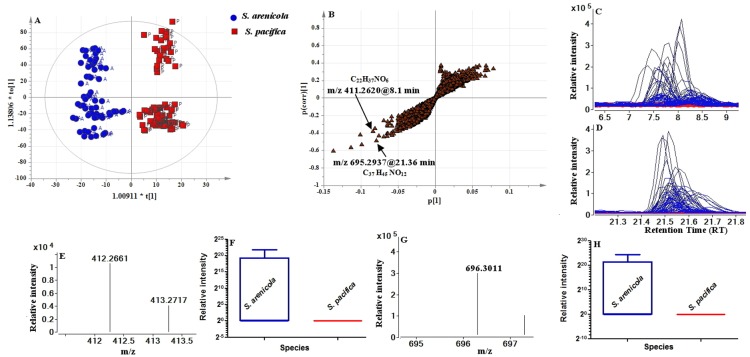
Figure 3. Metabolic profiling distinguishes bacterial samples from two Salinispora species S. arenicola and S. pacifica.
(A) OPLS-DA scores plot, predictive component t[1] versus orthogonal component (t0 [1]) showing the supervised separation between the two sample classes. The ellipse in A and B represents the Hotelling's T2 95% confidence interval for the multivariate data. (B) Loading S-plots derived from the LC-MS data set of two bacterial species. S-plot shows predictive component p[1] against the correlation p (corr) of variables of the discriminating component of the OPLS-DA model. (C) EIC of m/z 411 from all samples. (D) EIC of m/z 695 from two bacterial species. (E) Mass spectrum for m/z 411. (F) Box-and-whisker plot for m/z 411 – significantly present in S. arenicola but absent from S. pacifica (P<.0001) (G) Mass spectrum for m/z 695. (H) Box-and-whisker plot for m/z 695 – significantly present in S. arenicola but absent from S. pacifica (P<.0001).

