
Figure 1. Monte Carlo simulation and impact of slice profile deformation on FLASH signal.
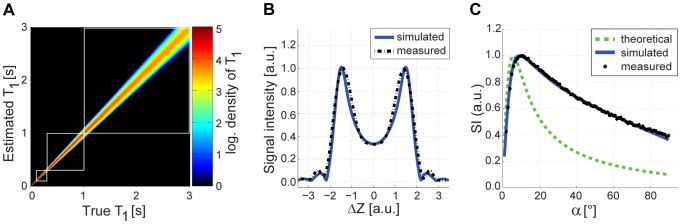
(a) Simulated density distribution (logarithmic) of true T1 values versus estimated T1 values derived from corrected 2D VFA using three flip angles. For each T1 value, 10000 experiments were performed. The use of three flip angles improved the T1 precision index by 11% compared using only two flip angles. (b) Bloch simulated (blue solid line) and measured (black dashed line) slice profiles (signal relevant component) in the steady state of a FLASH sequence show good agreement. The slice profile substantially deviates from an ideal rectangular slice profile. (c) Theoretical (green dashed line), Bloch simulated (blue solid line), and measured (black dots) signal intensities for FLASH as a function of the flip angle (at T1 = 1000 ms). The Bloch simulated signal intensities agree very well with the phantom measurements.