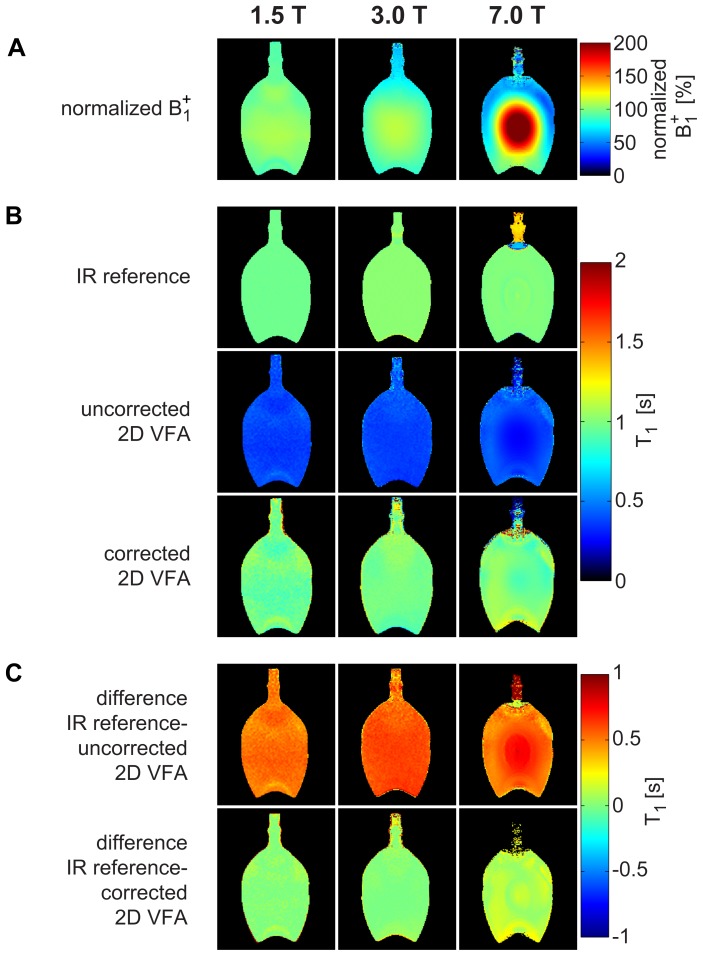
Figure 2. Normalized B1+ maps and T1 maps of the water phantom at 1.5T, 3T, and 7T.
(a) Measured B1+ normalized to the nominal B1+ (4,35 μT) in percent. (b, top row) T1 derived from the inversion recovery reference method (T1 = (963±7)ms at 1.5T, T1 = (1022±10)ms at 3T, T1 = (1002±10)ms at 7T). (b, center row) Uncorrected 2D VFA approach that does only consider B1+ but not slice profile deformations. Adjusted flip angles (α1 = 2°, α2 = 13°) were used. This approach revealed a T1 underestimation of −63.0±1.5% averaged over all field strengths (T1 = (372±28)ms at 1.5T, T1 = (376±23)ms at 3T, T1 = (357±60)ms at 7T) compared to the reference measurement. (b, bottom row) With the proposed B1+ corrected and slice profile distortion corrected 2D VFA measured a T1 deviation of only 0.2±1.4% averaged over all field strengths (T1 = (966±67)ms at 1.5T, T1 = (1010±47)ms at 3T, T1 = (1017±89)ms at 7T) compared to the reference measurement. (c, top row) Difference map between uncorrected 2D VFA and IR reference. (c, bottom row) Difference map between corrected 2D VFA and IR reference.

