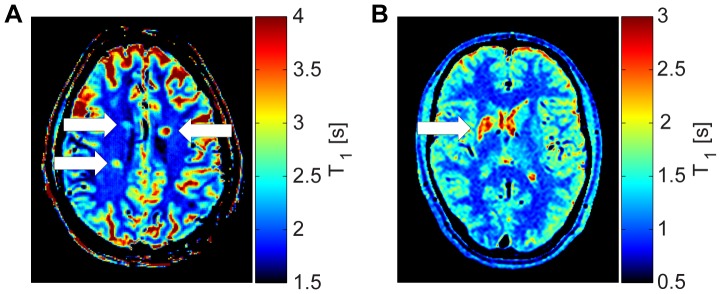
Figure 4. Patient measurements using the corrected 2D VFA method.

(a) T1-map of a multiple sclerosis patient at 7T using the corrected 2D VFA method. The map shows three periventricular lesions (white arrows). Mean T1 of the lesions was (2758±615)ms vs. (1842±62)ms in the surrounding white matter. (b) Corrected 2D VFA T1-map of a stroke patient derived from 3T acquisitions showing a subcortical lesion (white arrow). The stroke occurred five months before measurement. T1 of the lesion was (2554±316)ms vs. (951±74)ms in the surrounding white matter.
