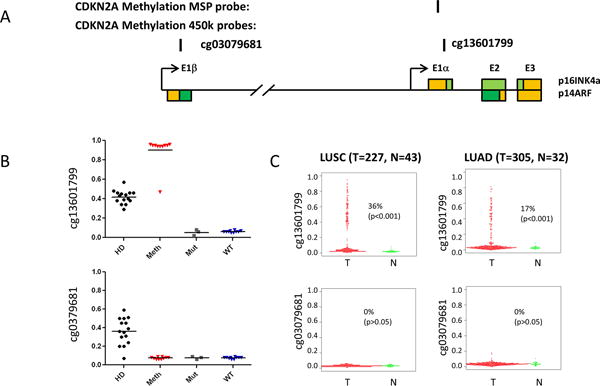
Figure 2.

Methylation of p16 promoter in lung cancers and cell lines. (A) Schematic diagram of CDKN2A (p14ARF-p16INK4a) genomic locus. Colored boxes represent exons of p16INK4a or p14ARF. The coding regions are shown as green, while the non-coding regions shown as yellow. The locations of the CDKN2A methylation-specific PCR (MSP) probe and corresponding illumina methylation450 beadchip probes are indicated. (B) The methylation status of p16 in the NSCLC cell lines by illumina methylation450 beadchip probes. The methylation beta values from cell lines carrying a homozygous deletion of the CDKN2A locus (HD), DNA methylation of the CpG island in exon 1a (p16INK4a) (Meth), a point mutation in p16INK4a (Mut), or no detectable alteration of the locus (WT) are plotted. A value of 0 indicates non-methylation of the locus; a value of 1 means complete methylation. (C) The methylation status of p16 in lung cancers from TCGA data portal by illumina methylation450 beadchip probes. The methylation beta values from squamous cell lung cancer (LUSC) or adenocarcinoma lung cancer(LUAD) and non-malignant lung tissues are plotted. Methlyation was defined as tumor samples with beta scores of 0.3 or higher than the mean values for non malignant tissues.
