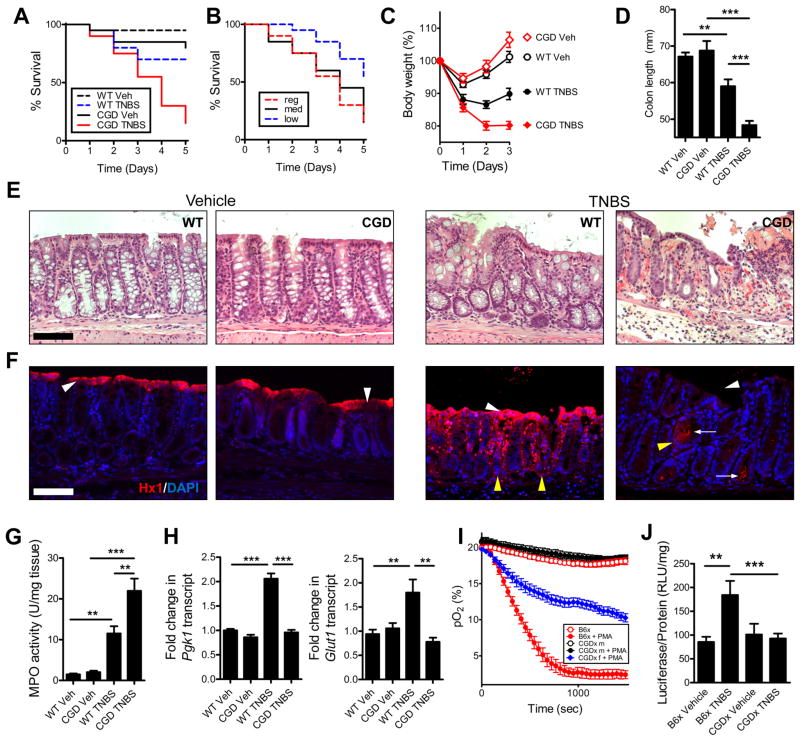
Figure 5. Neutrophil respiratory burst-deficient (CGD) mice develop severe non-resolving colitis.
(A) Survival curves for C57/B6 versus CGD following TNBS administration (P < 0.001 compared with vehicle; P < 0.05 compared with wild-type TNBS; Gehan-Breslow-Wilcoxon test). Data represents means ± SEM (n = 6). (B) Survival curves for CGD mice on regular (2.5% TNBS in 50% EtOH), medium (2% TNBS in 45% EtOH) and low TNBS regimen (2% TNBS in 40% EtOH). Data represents means ± SEM (n = 6) (P < 0.005 low compared with regular dose; P < 0.05 low compared with medium dose TNBS; Gehan-Breslow-Wilcoxon test). (C) Weight-loss curves and (D) colon lengths of CGD mice on low TNBS regimen indicated a defect in resolution. Data are represented as means ± SEM and are pooled from three independent experiments (n = 8–12). (E) Representative H&E stained sections revealed severe PMN accumulation in CGD mice treated with TNBS. (F) Hypoxyprobe (red) staining and nuclear (blue) counterstain of wild type versus CGD mice ± TNBS. White arrowheads indicate presence/absence of luminal epithelial cells; yellow arrowheads indicate crypts. Arrows indicate potential presence of bacteria. Scale bars = 100μm. (G) Myeloperoxidase activity assay indicated increased PMN in TNBS (**, P < 0.01; ***, P < 0.001; one-way ANOVA). Data are represented as means ± SEM and are pooled from three independent experiments (n = 8–12). (H) Hypoxia target gene expression from purified colonic epithelial cells for Pgk1 and Glut1 in TNBS. Data are represented as means ± SEM (**, P < 0.01; ***, P < 0001; one-way ANOVA). (I) O2 consumption of B6x versus CGDx m (male) and f (female) (P < 0.001 B6x ± PMA; P > 0.05 male CGDx ± PMA; P < 0.001 female CGDx versus B6x – PMA; P < 0.001 female CGDx versus B6x +PMA; two-way ANOVA). Data is representative of three independent experiments and presented as means ± SD (n = 6). (J) Tissue luciferase was assayed following a low TNBS regimen in both B6x (P < 0.01 Vehicle versus TNBS in B6x) and CGDx (P > 0.05 CGDx vehicle versus TNBS; P < 0.05 for B6x TNBS versus CGDx TNBS; one-way ANOVA). Data represented as means ± SEM and are pooled from two independent experiments (n = 8). See also Figure S4.

