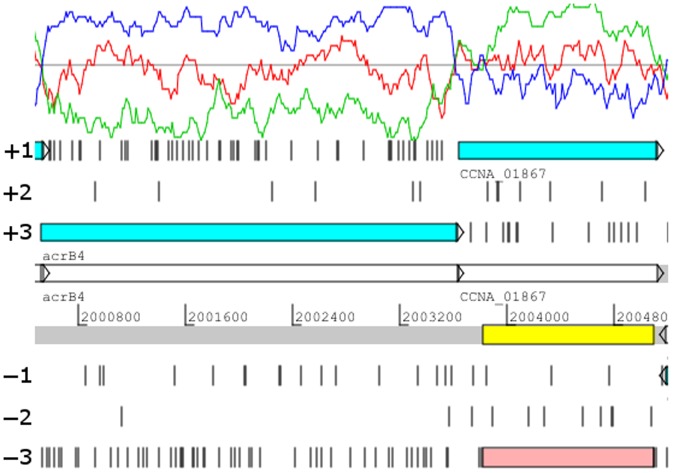
Figure 1. Screen shot of Artemis showing GC Frame Plot and a wrong reading frame.
The GC frame plot shows a sliding window of the third codon position GC content for the three forward reading frames. The red line in the GC frame plot corresponds to the +1 reading frame, the green line corresponds to the +2 reading frame and blue line to the +3 reading frame. The three reverse reading frames show the same pattern with the blue, red, green lines corresponding to the −1, −2 and −3 reading frames, respectively. Gene CCNA_1867 (blue bar) is in the wrong reading frame in the 23-DEC-2012 NA1000 annotation. The −3 open reading frame highlighted in pink is the corrected reading frame for gene CCNA_1867.

