
Fig. 2.
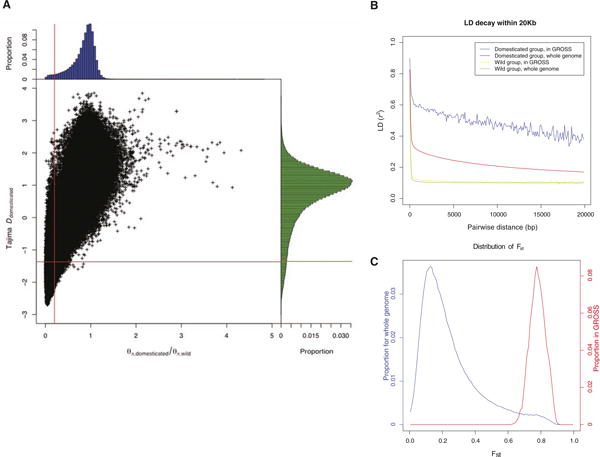
GROSS. (A) Two-dimensional distribution for θπ,domesticated/θπ,wild and Tajima's D for domesticated silkworms. 5-kb windows, data points of which locate to the left of the vertical red line (corresponding to Z test P < 0.005) and below the horizontal red line (also Z test P < 0.005), were picked out as building blocks of GROSS. (B) LD in GROSS. For domesticated silkworms, LD decays much more slowly in GROSS than in the whole genome, whereas for wild varieties, no obvious change in the pattern was observed. (C) Distribution of divergence between domesticated and wild groups in GROSS versus the whole genome (Fst) (7).