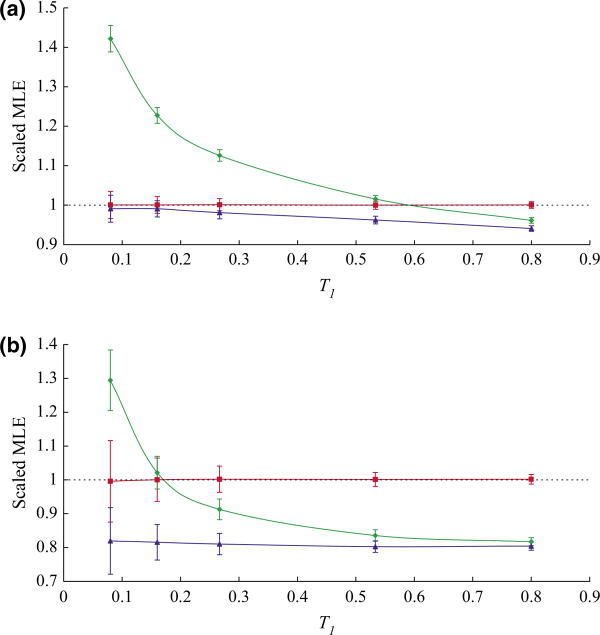
Fig. 2.
Data were simulated using population structure shown in Fig. 1b with population size N1 = N2 = 937.5 and different divergence times ranging from 3000 years to 30 000 years. (a) Ten samples were simulated from each focal population. (b) Two samples were simulated from each focal population. For each combination of divergence time and sample size, 1000 data sets were simulated. Average value of 1000 maximum likelihood estimates was scaled by and plotted against the true value of divergence time, with bars representing scaled standard deviations. Red line represents the result from fully parameterized method. Green line represents the result from IS-based method. Blue line represents the result from Beta-binomial method.

