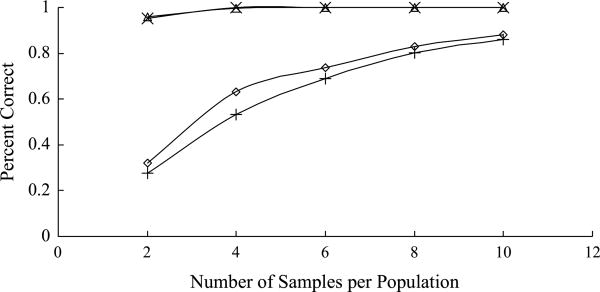
Fig. 5.
Data were simulated using two population trees shown in Fig. 4(a,b) with sample size ranging from 2 to 10. For each combination of true population tree and sample size, 1000 data sets were simulated. Population trees were estimated from each data set using our algorithm and Neighbor-joining algorithm. Number of correct trees was plotted against the sample size. Diamond represents the number of correct trees estimated by our algorithm with Fig. 4a as true tree. + represents the number of correct trees estimated by Neighbor-joining with Fig. 4a as true tree. Triangle represents the number of correct trees estimated by our algorithm with Fig. 4b as true tree. x represents the number of correct trees estimated by Neighbor-joining with Fig. 4b as true tree.

