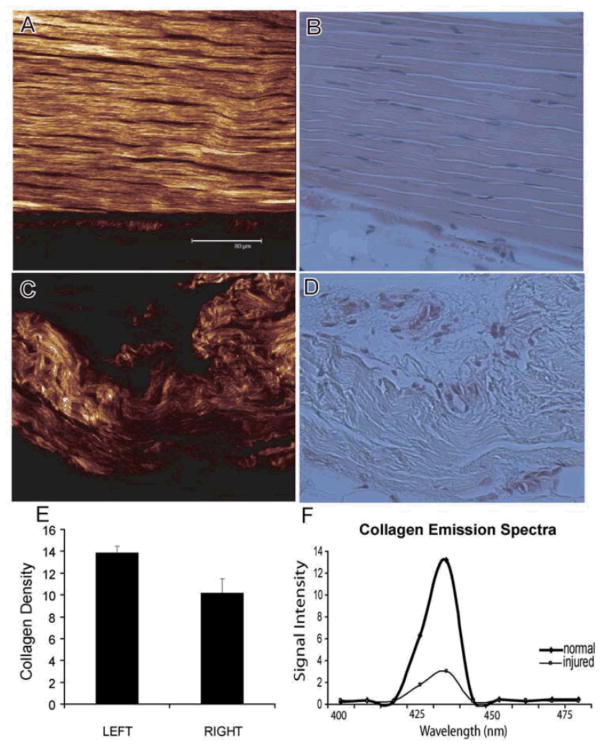
Figure 5.
Representative second harmonic generation (SHG: A,C) and corresponding histological images (H&E: B,D) of normal and injured tendon tissues. The scale bar in A is 80.0 _m, and all images are at the same scale. (E)We observe that the collagen density in the active repair area is significantly reduced compared to uninjured tendons (p=0.004). (F) A representative histogram of the detected SHG signal demonstrates the distribution of the collagen molecular density obtained from normal tendon as well as the one undergoing active repair. The detected SHG signal is clearly manifested by a narrow peak and is spectrally clean, arising only at the expected wavelength of 440 nm. Considerable differences in the collagen matrix are observed between the normal and injured tendon tissues.

